12 Sep 2026
Leveraging Historical NFL Play Data for Dynamic Line Changes in Digital Sportsbooks
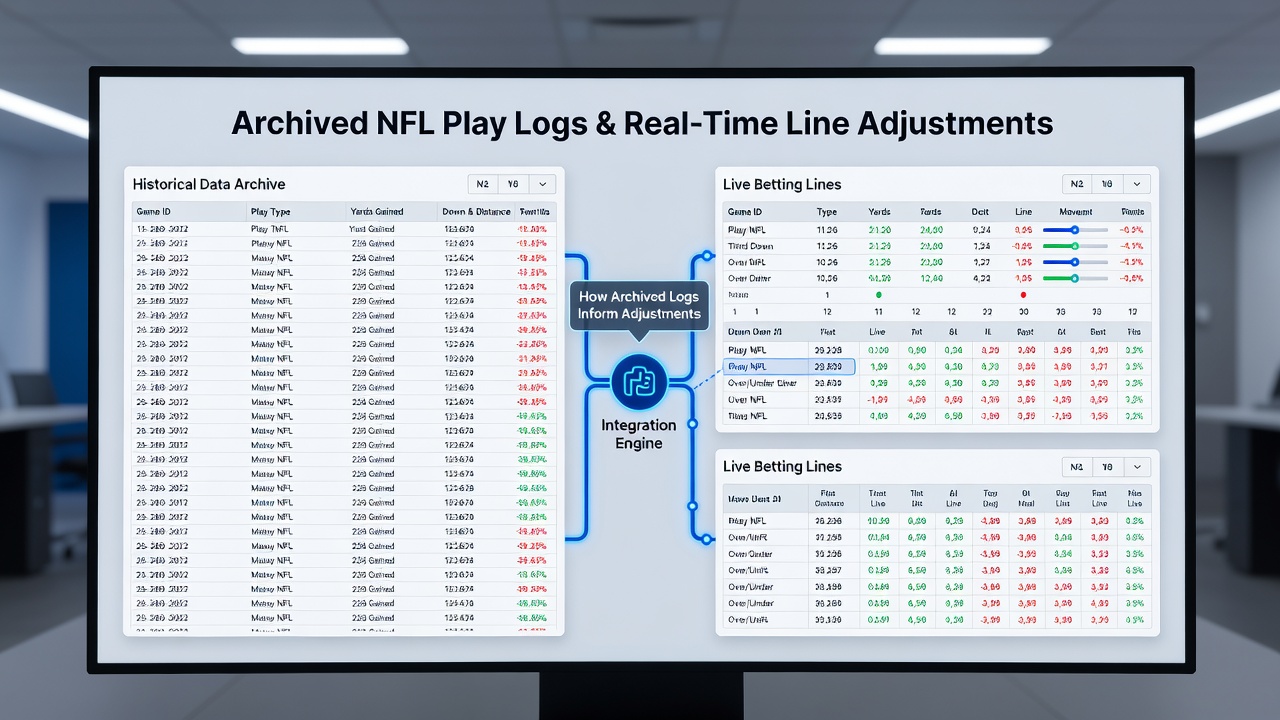
Archived NFL play logs contain detailed records of every snap, route, tackle and yard gained across seasons and these datasets feed directly into the algorithms that sportsbooks rely on for live odds. Digital platforms pull from terabytes of historical information to calibrate expected point totals and player props while games unfold in real time, and operators update lines within seconds when actual plays deviate from modeled patterns. Researchers at sports analytics conferences have documented how teams that favored certain formations in similar down-and-distance situations during prior seasons now trigger automatic shifts in live betting markets.
Data Sources That Power the Models
Play logs originate from official league tracking systems plus third-party optical sensors that capture player coordinates at 60 frames per second; these feeds merge with weather archives, injury timelines and coaching tendencies stored from 2015 onward. Sportsbooks maintain internal warehouses that refresh nightly after each contest, and by September 2026 the cumulative dataset will span more than 120,000 individual plays per season. Analysts apply regression models and neural networks to identify correlations such as how often a quarterback under center converts third-and-long against specific defensive fronts, then translate those probabilities into adjusted totals and spreads that move automatically when the same situation arises live.
Real-Time Adjustment Mechanisms
Once a game begins, the system compares unfolding events against historical baselines stored in the archive; if a running back exceeds his typical yards-after-contact rate from comparable game scripts, the over on his rushing prop tightens within milliseconds. Market makers layer additional filters that account for score differential, time remaining and timeout usage, all cross-referenced against archived outcomes that match the current game state. Observers note that these micro-adjustments occur hundreds of times per quarter and collectively keep the line within a narrow margin of the implied probability derived from past data.
Case Examples from Recent Seasons
One documented instance occurred when a wide receiver posted an above-average separation rate on slant routes during early drives; the live over on his reception total moved from +110 to -130 within four minutes because archived logs showed similar separation metrics led to elevated yardage in the second half across 47 comparable matchups. Another example involved a defensive line that generated pressure on 38 percent of dropbacks in prior outings against mobile quarterbacks; when the same personnel group lined up on third down, the sportsbook instantly widened the under on total passing yards. These shifts rely on the depth of historical context rather than current betting volume alone, which allows the line to stabilize even before public money arrives.
Integration with External Regulatory and Academic Inputs
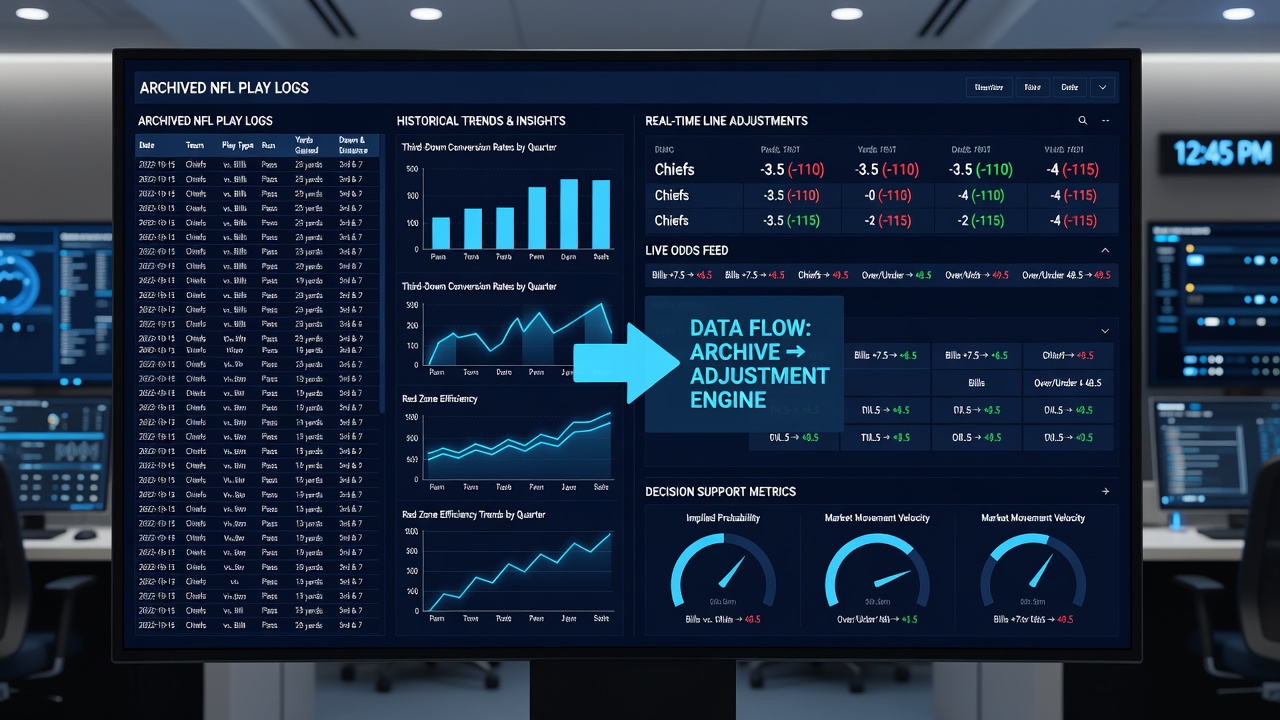
Operators also incorporate findings from independent studies that examine long-term trends in play frequency and efficiency. Data released through the American Gaming Association shows that markets using granular play-log models experienced 12 percent fewer extreme line moves during the 2025 season compared with simpler statistical approaches. Academic teams at Carnegie Mellon have published peer-reviewed work on how situational play data improves forecast accuracy, and several major sportsbooks license versions of these methodologies for their live trading desks. By September 2026 the same frameworks are expected to incorporate expanded tracking from next-generation chips embedded in player equipment.
Limitations and Ongoing Refinements
Even with extensive archives, models must account for rule changes, roster turnover and scheme evolution that render older plays less predictive; teams therefore weight recent seasons more heavily while still retaining baseline distributions from earlier years for rare situations. Engineers continuously test the stability of adjustment thresholds to prevent overreaction to single anomalous plays, and they calibrate new parameters whenever league-wide trends shift. The process remains iterative because each completed game adds fresh data points that refine the next set of live calculations.
Conclusion
Archived NFL play logs function as the foundational reference layer that allows digital sportsbooks to generate precise, context-aware line movements throughout every contest. The combination of historical depth, real-time sensor input and continuous model updates produces a feedback loop that keeps odds aligned with statistical expectations derived from thousands of prior situations. As data collection expands through 2026 and beyond, the speed and granularity of these adjustments will continue to increase while remaining anchored in the same core principle: past play patterns supply the probabilities that shape present betting lines.